Ultimate Trading Resources Kit! Launch Sales : 90% OFF

Hurry Up! Don't Miss The Opportunity
Limited Time Offer!!
COMPLETE TRADING
MATERIAL Beginner To
Advanced Level Strategy
Premium 7 + E-Book Lifetime Validity
Intraday Trading
Option Trading
Advanced Highly Profitable Trading Pattern
Trading strategies
Indicators
Premium E-Book CandleStick & Chart Patterns
Today's Price (90% Discount)
Special Offer
Rs. 1999 Rs. 197
Here's What All You'll Get...

Price Action Trading

Candlesticks Ebook
Chart Pattern

Stock Market Basics
Trading Indicators

Trading Strategies

Checklist For Trading
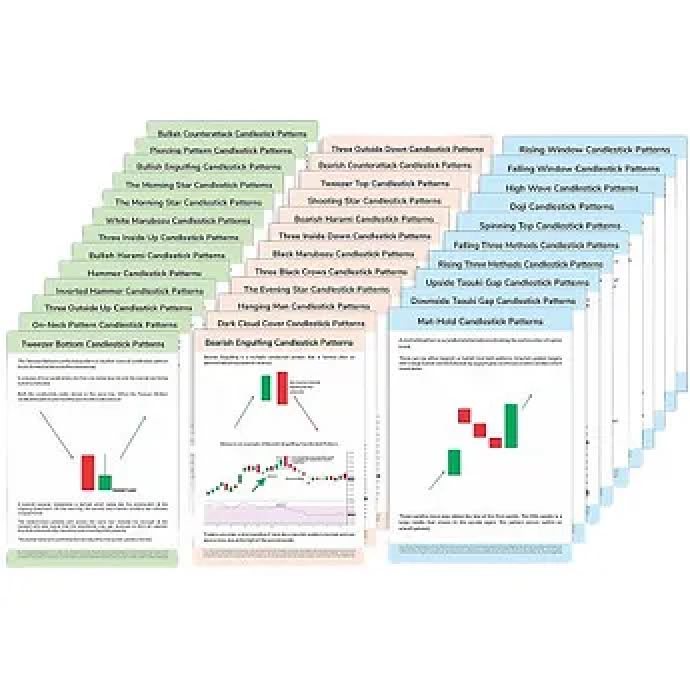
Candlestick Sheets
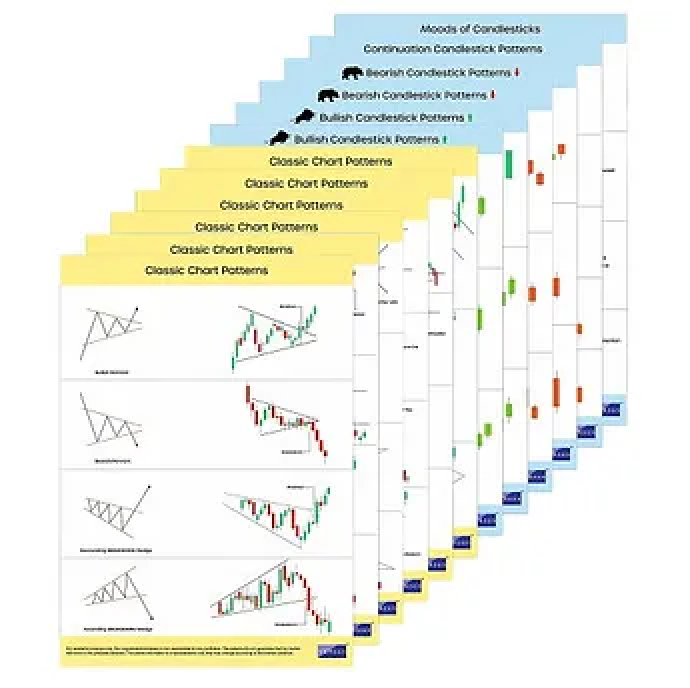
Chart Pattern Sheet
That's A Wealth Of Information And Tools To Enhance Your Trading Strategy, And It's All Available For An Incredible Price OnlyRs 197.
Original Price: Rs. 1999...You Save Rs. 1900
Frequently Asked Questions
Q. What I Will Get After Purchase?
After Successful Payment, You Can Download All Instantly. You Will Be Redirected Automatically To Another Page. From There You Can Download it All Instantly. You Will Get A Well-organized PDF file Automatically Just After Your Purchase On Your Email Id. With Download Links.
Q. How I Will Get the Product Or Download Product?
After Successful Payment, You Can Download All Instantly. You Will Be Redirect Automatically To Another Page. From There You Can Download All Instantly.
Q. Is It Available Lifetime?
For Your Safe Side, We Recommend You To Download All Necessary Files And Save It In Your Computer. So That You Can Access It Anytime.
Q. What Is The Best Timeframe to analyze the Stock Market?
Intraday/Short-term/options Trading: For traders who focus on short-term price movements, time frames such as 5-minute, 15-minute, or 1-hour charts can be useful. These charts provide a detailed view of price action and are commonly used by day traders or scalpers.
Swing Trading: Swing traders typically hold positions for several days to weeks. They often use time frames like 4-hour, daily, or weekly charts to capture medium-term price swings and trends. These time frames provide a broader perspective and help identify longer-term chart patterns.
Position Trading/Investing: Investors and position traders who take a long-term view often refer to weekly or monthly charts. These time frames help identify major trends and are useful for determining long-term investment strategies.
Original Price: Rs. 1999...You Save Rs. 1900